Like other FX pairs, USDJPY has been held in a tight range for the past two full weeks.
There is a lack of clarity regarding the outlook for US cuts due to contradicting data, supplemented by Markets having digested a more balanced/dovish tone from Powell rather than a fully dovish one (from a more balanced/hawkish tone regarding the impact of tariffs).
The question remains: Will there be only 2 cuts this year? This would not change much to the FED’s quarterly outlook from previous meetings.
Markets are also awaiting more information regarding who will be the next FED board member. Reactions to the US Dollar have been minimal regarding the firing of Lisa Cook, a board member (hence a continuous voter).
The Bank of Japan has been waiting for the Federal Reserve to cut rates to reduce the huge rate differentials that have hurt the Yen throughout the past 3 years.
Luckily for the BoJ, a basis trade unwind in July 2024, combined with US Dollar weakness, has gradually naturally reduced the Yen’s relative weakness. However, it is still at relative lows against its European peers.
Let’s examine USDJPY multi-timeframe technicals to see if the daily USD rally is enough for the pair to break out of its range and establish its boundaries.
USDJPY multi-timeframe technical analysis
USDJPY Daily Chart
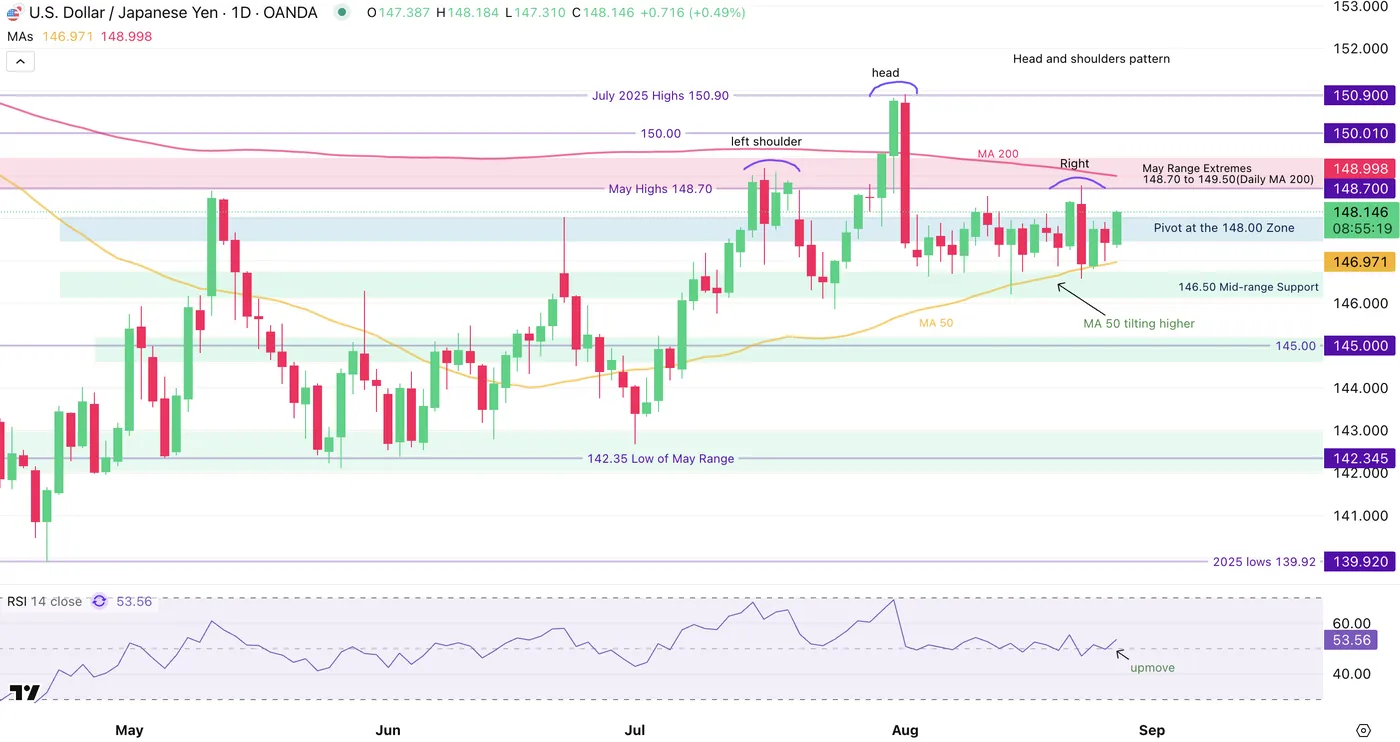
USDJPY Daily Chart, August 27, 2025 – Source: TradingView
The most volatile FX pair has been held into a 1,000 to 1,900 pip range for the past 18 days, a prolonged consolidation compared to the usual.
Despite all of the headlines throughout the year, nothing really changed compared to the fundamentals of the year-beginning – Markets are still awaiting for a concrete change to the main rates for both the FED and the Bank of Japan, leading to some mostly rangebound action since May.
The range has tightened quite a lot however this month, located between 146.80 (lows) to 148.70 (range extremes), with the price action located between the 50 and 200-Day Moving averages acting as key boundaries.
As a matter of fact, they will be acting as key indicators for a more concrete breakout – expect rangebound action as long as prices remain within these boundaries.
Let’s discover where they stand just below.
USDJPY 4H Chart
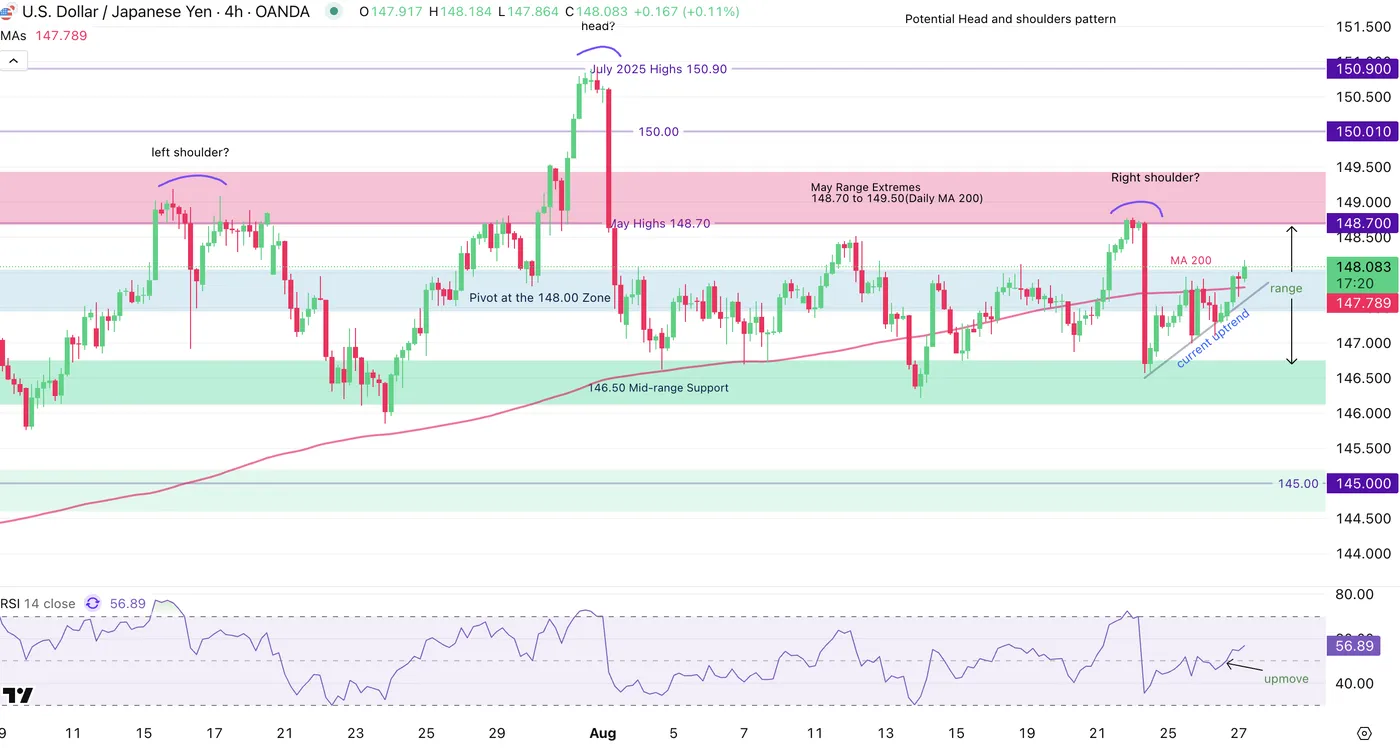
USDJPY 4H Chart, August 27, 2025 – Source: TradingView
The 4H timeframe allows to spot the current price action heading higher as the current US Dollar buying is bringing the pair above the 200 4H-period MA in a higher-low formation, supported by a short-timeframe upward trendline.
A higher timeframe Head and Shoulders could also be into play but its long-shape may not create enough clarity to make the pattern valid – It is still noteworthy but hold about a 35% chance of materializing further.
Key trading Levels for USDJPY:
Resistance Levels
- 148.78 last Friday highs
- May range extremes from 148.70 to 149.50 (daily MA 200 in confluence)
- 149.00 200-Day MA Key range resistance
Support Levels
- Pivot at the 148.00 zone (acting as immediate support)
- 147.00 50-Day MA Key range support
- 146.50 mid-range and immediate support (Daily MA 50 in confluence)
- 145.00 psychological support
USDJPY 1H Chart
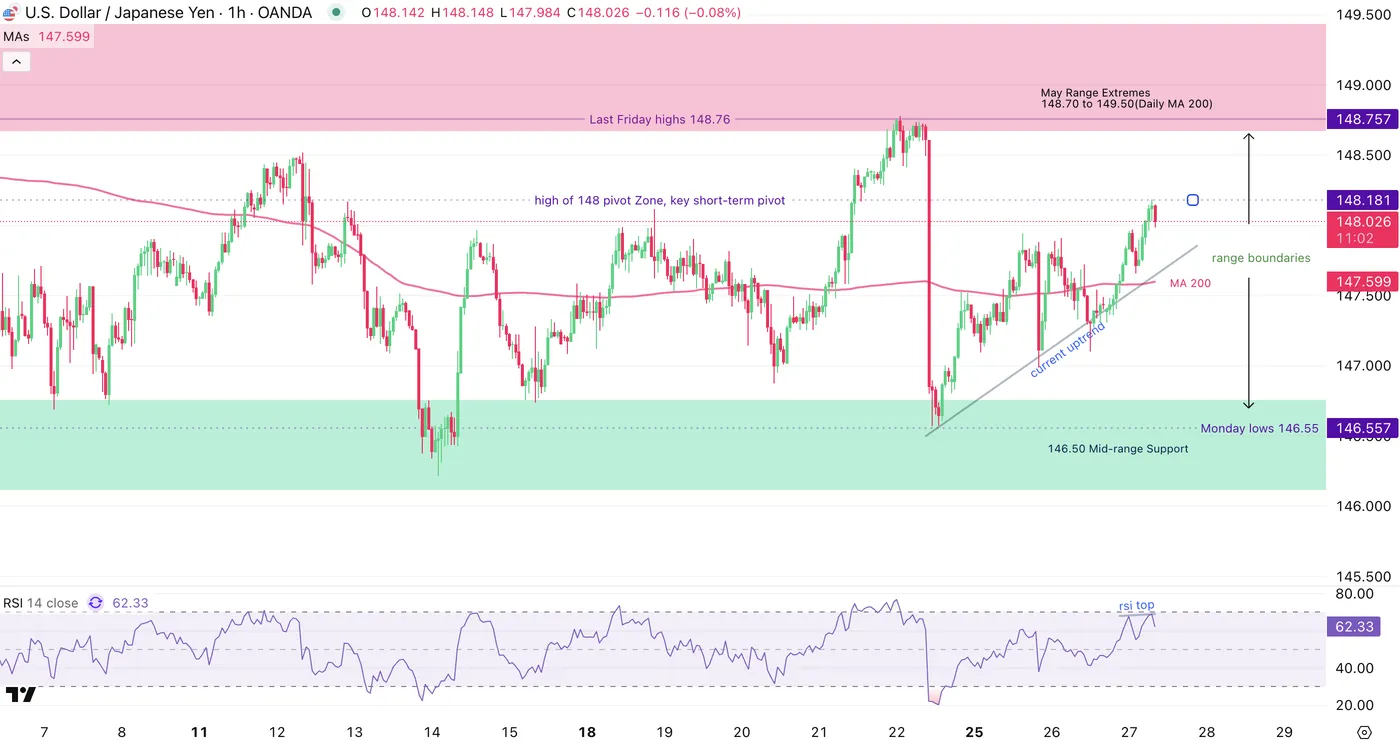
USDJPY 1H Chart, August 27, 2025 – Source: TradingView
Looking even closer, bulls will have to push harder to break the last Friday highs as price action is stalling at the high of 148 pivot Zone, a key short-term pivot.
Particularly as markets lack further data and fundamentals to break out from rangebound price action, the short-term outlook is more rangebound than breakout-prone.
Look at the top in the 1H RSI, if buying goes further, it will add to more chances of testing the range extremes around the last Friday highs.
Safe Trades!