[ad_1]
Australia’s Gross Domestic Product (GDP) rose 0.6% QoQ in the second quarter (Q2) of 2025 compared with the 0.3% growth in the first quarter (revised from 0.2%), the Australian Bureau of Statistics (ABS) showed on Wednesday. This reading came in stronger than the expectations of 0.5% expansion.
The annual second-quarter GDP grew by 1.8%, compared with the 1.4% growth in Q1 (revised from 1.3%), while above the consensus of a 1.6% increase.
Additional takeaways from the Australian GDP data
GDP rose 1.3% in 2024-2025.
The terms of trade fell 1.1%.
Household saving to income ratio fell to 4.2% from 5.2%.
Market reaction to Australia’s GDP data
The upbeat Australia GDP report provides some support to the Australian Dollar (AUD). The AUD/USD pair is trading at 0.6524, losing 0.06% on the day.
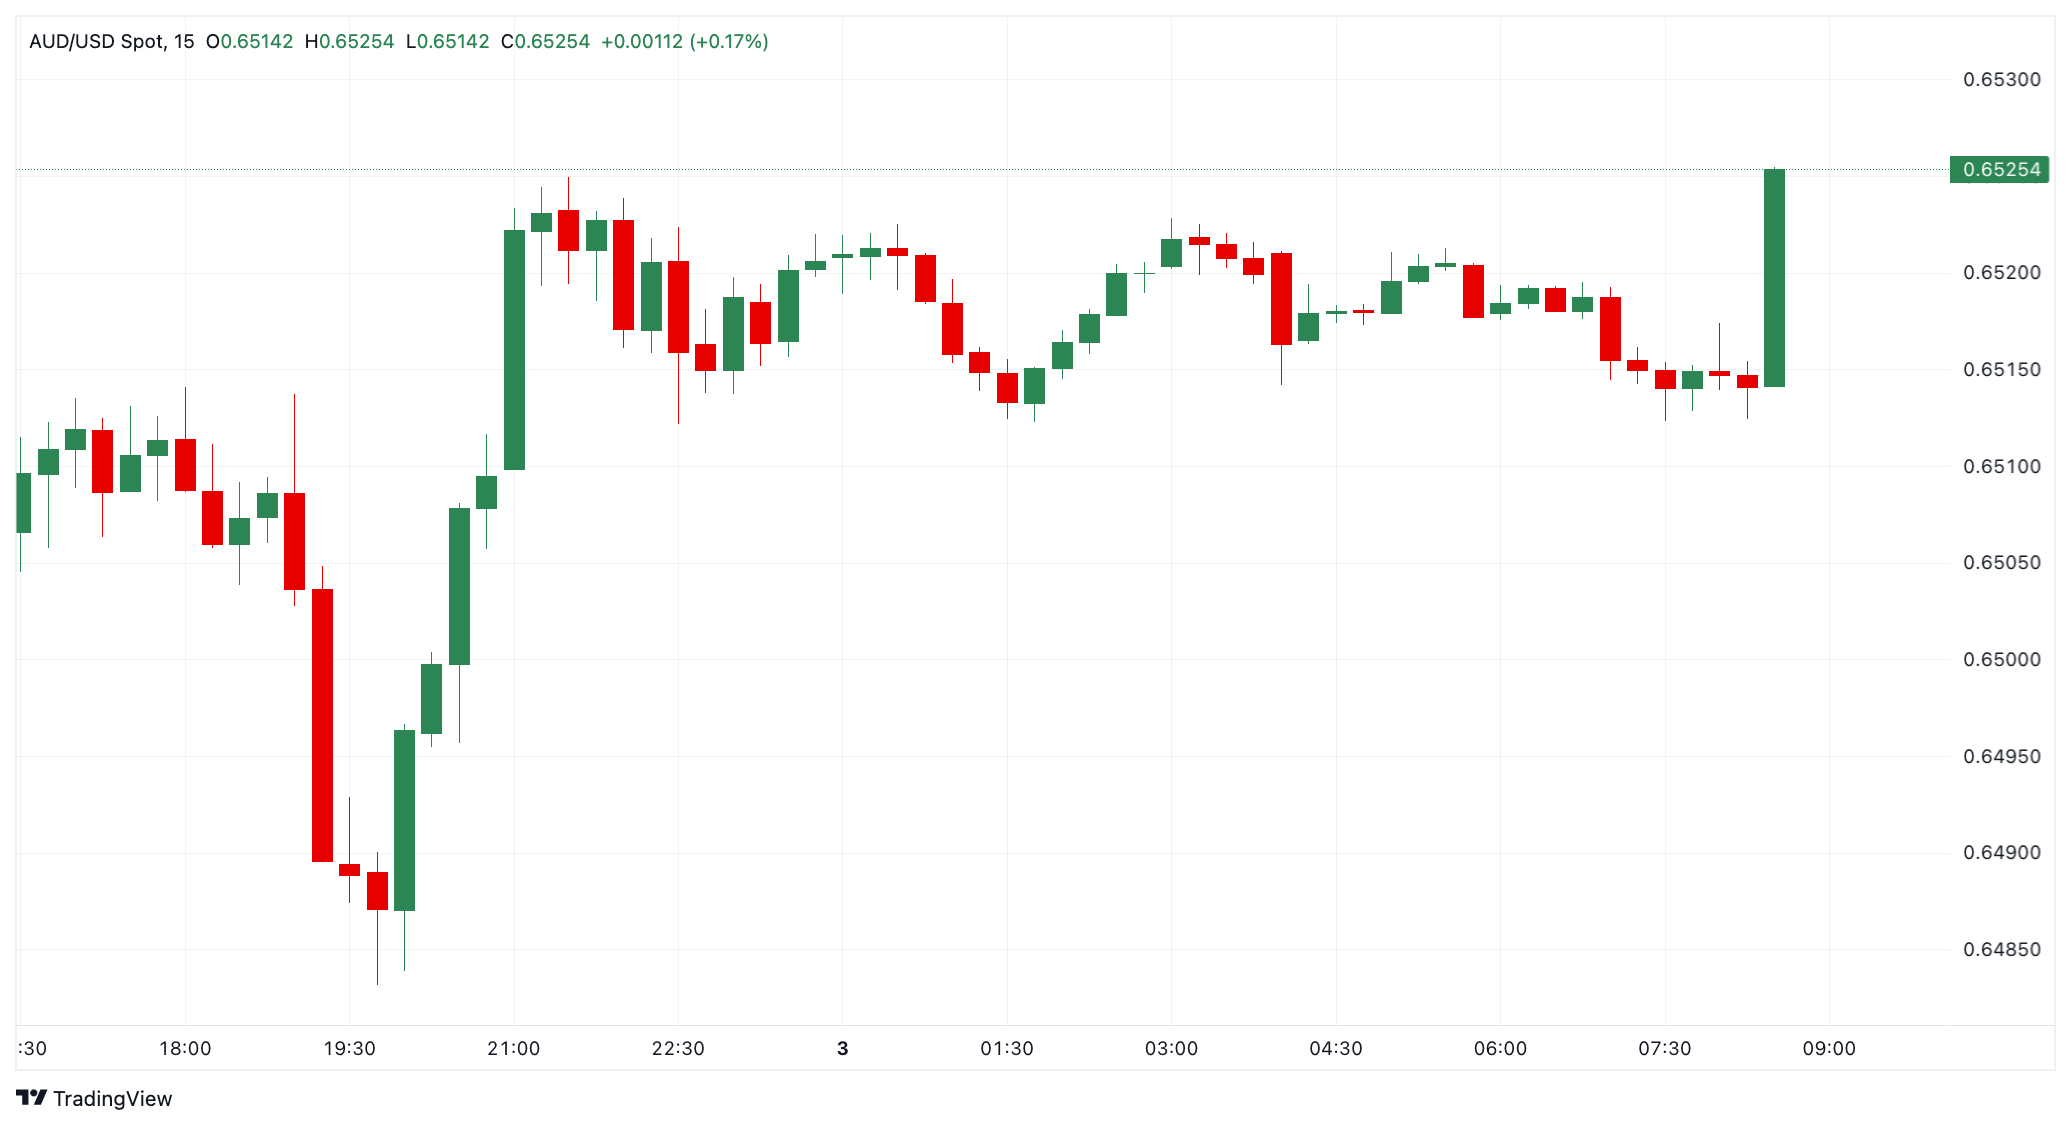
AUD/USD 15-min chart
Australian Dollar Price Last 7 Days
The table below shows the percentage change of Australian Dollar (AUD) against listed major currencies last 7 days. Australian Dollar was the strongest against the Japanese Yen.
| USD | EUR | GBP | JPY | CAD | AUD | NZD | CHF | |
|---|---|---|---|---|---|---|---|---|
| USD | 0.12% | 0.83% | 1.01% | -0.35% | -0.48% | 0.05% | 0.21% | |
| EUR | -0.12% | 0.70% | 0.85% | -0.52% | -0.67% | -0.12% | 0.04% | |
| GBP | -0.83% | -0.70% | 0.20% | -1.17% | -1.26% | -0.77% | -0.62% | |
| JPY | -1.01% | -0.85% | -0.20% | -1.34% | -1.51% | -0.98% | -0.75% | |
| CAD | 0.35% | 0.52% | 1.17% | 1.34% | -0.13% | 0.42% | 0.56% | |
| AUD | 0.48% | 0.67% | 1.26% | 1.51% | 0.13% | 0.56% | 0.71% | |
| NZD | -0.05% | 0.12% | 0.77% | 0.98% | -0.42% | -0.56% | 0.16% | |
| CHF | -0.21% | -0.04% | 0.62% | 0.75% | -0.56% | -0.71% | -0.16% |
The heat map shows percentage changes of major currencies against each other. The base currency is picked from the left column, while the quote currency is picked from the top row. For example, if you pick the Australian Dollar from the left column and move along the horizontal line to the US Dollar, the percentage change displayed in the box will represent AUD (base)/USD (quote).
This section below was published at 22.45 GMT on Wednesday as a preview of the Australia’s Gross Domestic Product report
- Australian Gross Domestic Product is forecast at 0.5% in the second quarter of 2025.
- The Reserve Bank of Australia reduced the Official Cash Rate to 3.60% in its August meeting.
- The Australian Dollar trades with a soft tone a handful of pips above the 0.6500 mark.
Australia will release its second-quarter (Q2) Gross Domestic Product (GDP) on Wednesday, with financial markets anticipating growth ahead of the announcement. The Australian Bureau of Statistics (ABS) is expected to report that the economy made modest progress in the three months to June 2025. The quarter-on-quarter (QoQ) GDP is foreseen at 0.5%, improving from the 0.2% posted in the previous quarter, while the annualised reading is foreseen at 1.6% after posting 1.3% in the first quarter of the year.
The Australian Dollar (AUD) heads into the release with a soft tone amid broad US Dollar (USD) demand, the latter triggered by a sell-off in United Kingdom (UK) government bonds. The yield on the 30-year note climbed to 5.66% in the European morning, its highest since 1998. The risk-averse environment weighs on the AUD and partially overshadows the impact of data releases.
What to expect from the Q2 GDP report
Australian growth picked up modestly at the end of 2024 and remained stable in the three months to March 2025, with the annualized GDP steady at 1.3% in the previous two quarters.
In the meantime, the Reserve Bank of Australia (RBA) contributed to economic progress by trimming the Official Cash Rate (OCR) in February 2025. It was the first rate cut in four years. Given that the central bank has been utterly cautious in lowering interest rates, the impact of this year’s decision is yet to be seen. The RBA has delivered three 25-basis-point (bps) rate cuts so far this year, the latest being in August.
Back then, policymakers noted that inflation had fallen substantially since the peak in 2022, “as higher interest rates have been working to bring aggregate demand and potential supply closer towards balance.” At the same time, however, the RBA downgraded its full-year GDP forecasts for 2025 to 1.7% from 2.1%.
The statement released by the Board also reads: “Uncertainty in the world economy remains elevated. There is a little more clarity on the scope and scale of US tariffs and policy responses in other countries, suggesting that more extreme outcomes are likely to be avoided.”
It is worth noting that the global trade environment has changed. Ahead of the August RBA meeting, United States (US) President Donald Trump’s tariffs came into effect. Australia faces a baseline 10% levy, which is not terribly disruptive but still a problem. Nevertheless, policymakers made it clear that the downward revision to the GDP forecast is owed more to a lower outlook for productivity growth, instead of trade disruptions.
In the current environment, market analysts expect another rate cut in November, the last one for this year.
How can the GDP report affect the Australian Dollar?
The Q2 GDP report will be released on Wednesday at 01:30 GMT. Ahead of the announcement, the AUD/USD pair battles to retain the 0.6500 threshold. The pair is sharply down on a daily basis, trimming half of the previous week’s gains.
Generally speaking, a better-than-anticipated GDP outcome would be positive for the AUD, while discouraging figures would put the currency under selling pressure. At this point, a growth acceleration below expectations would not affect the RBA’s monetary policy stance, meaning it should not affect the odds for future interest rate cuts.
Valeria Bednarik, Chief Analyst at FXStreet, notes: “The AUD/USD pair could gain extra-bearish traction once below the 0.6490 price zone, as the daily chart shows that buyers are aligned around a flat 20 Simple Moving Average (SMA), which is barely enough to contain the decline. The same time shows that technical indicators have rotated south, although they still hold within neutral levels. The next relevant support and a potential bearish target comes at the 100 SMA, currently at 0.6480. Further slides should see the pair extending its slide towards the 0.6430 region.”
Bednarik adds: “The AUD/USD pair would face initial resistance at 0.6535, Monday’s low, followed by the weekly peak at 0.6560. A clear break above the latter exposes the 0.6600 threshold.”
Economic Indicator
Gross Domestic Product (QoQ)
The Gross Domestic Product (GDP), released by the Australian Bureau of Statistics on a quarterly basis, is a measure of the total value of all goods and services produced in Australia during a given period. The GDP is considered as the main measure of Australian economic activity. The QoQ reading compares economic activity in the reference quarter to the previous quarter. Generally, a rise in this indicator is bullish for the Australian Dollar (AUD), while a low reading is seen as bearish.
GDP FAQs
A country’s Gross Domestic Product (GDP) measures the rate of growth of its economy over a given period of time, usually a quarter. The most reliable figures are those that compare GDP to the previous quarter e.g Q2 of 2023 vs Q1 of 2023, or to the same period in the previous year, e.g Q2 of 2023 vs Q2 of 2022.
Annualized quarterly GDP figures extrapolate the growth rate of the quarter as if it were constant for the rest of the year. These can be misleading, however, if temporary shocks impact growth in one quarter but are unlikely to last all year – such as happened in the first quarter of 2020 at the outbreak of the covid pandemic, when growth plummeted.
A higher GDP result is generally positive for a nation’s currency as it reflects a growing economy, which is more likely to produce goods and services that can be exported, as well as attracting higher foreign investment. By the same token, when GDP falls it is usually negative for the currency.
When an economy grows people tend to spend more, which leads to inflation. The country’s central bank then has to put up interest rates to combat the inflation with the side effect of attracting more capital inflows from global investors, thus helping the local currency appreciate.
When an economy grows and GDP is rising, people tend to spend more which leads to inflation. The country’s central bank then has to put up interest rates to combat the inflation. Higher interest rates are negative for Gold because they increase the opportunity-cost of holding Gold versus placing the money in a cash deposit account. Therefore, a higher GDP growth rate is usually a bearish factor for Gold price.
[ad_2]
Source link